Our micro inverter based solar installation (panel power: 16.46 kWp, AC output power: 12.2 kWp) runs since February 2025. (open picture in new tab to zoom in)


Our micro inverter based solar installation (panel power: 16.46 kWp, AC output power: 12.2 kWp) runs since February 2025. (open picture in new tab to zoom in)


Luxembourg’s smart meter branded as Smarty by the electric grid managing company CREOS allows monitoring your electricity consumption and production as well as your gas consumption. Additionally it allows the grid operator to control certain electrical appliances in your household.
If parts of the electricity grid in Luxembourg are becoming overloaded or unstable, the grid operator can remotely command the Smarty smart meter to take action to protect the grid. Smarty can diminish the power of domestic car charging points from 11kW to 7kW. As of writing this, CREOS confirms not using this feature (January 2025).
Smarty can also reduce the power of photovoltaic systems to about a third of the available power, if your PV management system allows this. If not, the shedding relay (FR: relais de délestage) will fully shut down the PV system when asked by the grid operator. It seems that this is currently not used neither by CREOS.
Smarty can also limit charging power of night storage heaters (DE: Nachspeicherheizung, FR: chauffage à accumulation) systems through shedding relays.
Every 15 minutes, the Smarty transmits to the grid operator (or the third party data collection partner) the average electricity consumption of the last 15 minutes. This is used to bill the quantity of electrical energy that was consumed, as well as the monitoring of the load that you used on the grid.
As of 1st January 2025, every household in Luxembourg is categorised in a power consumption category. Most households are in category 3 kW. Households with electric cars or heat pumps might be categorised into 7 kW or 12 kW categories. The monthly costs depend on the power consumption class that you are in.
If you are in the 3 kW category, and you drag 5 kW from the grid for about an hour, you have to pay additional fees (FR: supplément pour le dépassement), in this case: 5-3=2 kWh, which currently equals to 2*0.1139€ = 0,2278€.
If you use for example a (tea) water heating device that pushes your maximal power consumption over the 3 kW limit for about a minute, the fact that Smarty calculates the average over 15 minutes should assure that this short stepping over your category’s boundaries should not be visible on your invoice.

To find out what your power category is, check your electricity provider’s portal, like myenovos.eu.
When you are running a balcony power plant (DE: Balkonkraftwerk), you might be interested in how the Smarty manages billing or settlements of electricity production over the three phases. In Luxembourg, a normal household is connected to the power grid on 3 phases each capable of pumping 40A of current.
When you connect such a small photovoltaic system to a power socket on your balcony, it will feed the produced electricity only to the phase where you connected it. But this might not be the phase where your house is consuming most electricity, so you are feeding your produced electricity to the grid and drag the electricity from the grid that you need on the other phase (buying from thew grid is much more expensive then what you get paid for injecting electricity).
But there is good news: the smarty will balance this out (DE: saldierender Stromzähler), as it sums up power consumption on all three phases and power production on all three phases and only considers the difference for billing. Without this, a (mono-phase) balcony power plant is not really interesting for private use.
[Unfortunately I only have oral confirmation of this from an engineer. No guarantee on this information. It might also change over time.]
You have three possibilities to extract consumption and production data from your Smarty smart meter.
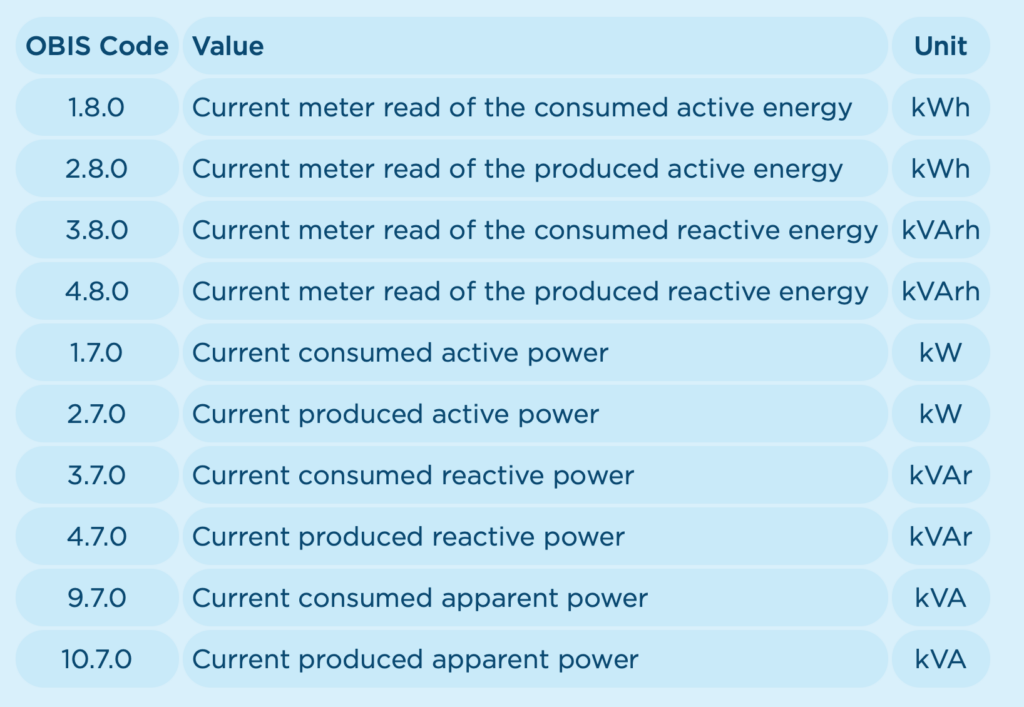
(1) By default, Smarty shows the most important values in a 5 seconds rhythm. Additionally: With the green button on your Smarty, you can cycle through the data that the meter gathers. To understand what value is currently displayed, Smarty adds the OBIS code to the display.

(2) Plug the Smarty+ dongle into your Smarty meter’s P1 port and monitor your data on your smartphone
(3) Connect the P1 port over a serial / USB to a computer and monitor your data using a home automation software like for example openHAB with the help of the DSMR binding.
When using the P1 port, solution 2 & 3, you need to ask the grid operator to give you the P1 decryption key.
Source for most of the information above: https://www.creos-net.lu/en/individuals/practical-info/faq
Some information was confirmed in a telephone discussion with a grid engineer in January 2025. The general disclaimer applies here too, of course!
Out of the box, a lot of solar thermal energy installations are not really functioning in a transparent way. It is quite difficult to really know what the installation is doing and how much energy it adds into the warm water reservoir. Our installation, a Buderus gas condensing boiler system (Logamax plus GB162-25 V3) that manages our solar thermal panels, does give some information on the output of the system, but it does not have a unit, thus the numbers are not really directly interpretable, besides seeing if you produced more, less or a lot less/more energy through the solar thermal panels compared to the previous days.

Solar thermal installation’s added energy to the warm water system
After 10 years, our solar thermal installation failed to function for an undefined period of time (we don’t know how the system really failed), including at least one summer. The result was that the solar liquid became very viscous as during the summer months it overheated and boiled in the panels. The result was partially blocked hoses carrying the solar liquid from the roof to the heating system in the basement. Fortunately, some minor flow still was assured so that we could flush the whole system and get rid of most of the solidified liquid that was blocking the hoses. A faulty pump was the reason for this failure.
The Buderus management system showed that the pump was working. What I did not know was, that the display only indicated that it had sent electricity to the pump. It did not get any reliable feedback from the pump indicating if the pump really pumps. So technically, the user is blind and does not really know if the pump is really working or not. After flushing the hoses and panels, as well as installing a new pump, the system was refilled with fresh solar fluid and luckily the system came back to life.
I was then looking for a monitoring solution and find this device from a dutch enthusiast. Its EMS-ESP software helps me render the information from my heating system, including solar thermal panels, visible in my home automation system.
From there started a journey to understand how the heating system works and figuring out how to set it up correctly. To optimise the system, maximise the collection of heat from the sun and minimise gas consumption and heat losses, I worked on the following variables:
We found it particularly difficult to find objective real life data on the usage of solar heat panels for hot drinking water. Our solar system (installed for for hot water only, not for heating up the house) is configured to allow for hot drinking water temperatures up to 80°C. A (child-)protection is installed so that the boiler will never deliver more than 60°C at all times. The gas condensing heating system only kicks in when the water temperature in the upper part of the water reservoir drops to 45 °C and will stop heating when the upper part is at 55°C. The following examples are based on real data coming out of our system, which consists of a Buderus Logamax Plus GB162-25 v3 gas condensing heater and a Buderus SM300/1 W warm water reservoir.
To better understand how these water heating systems function, feel free to consult this article (in german). The article also shows a graph of the water reservoir with the upper and lower parts and its corresponding heating systems.

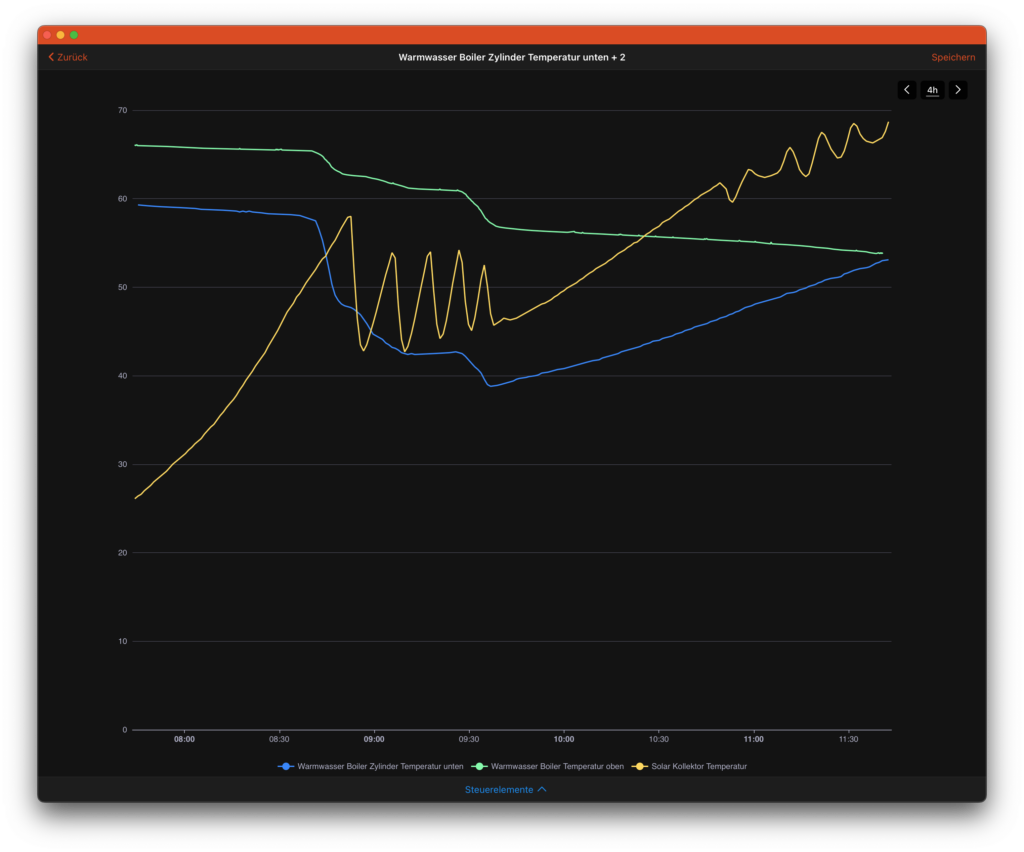
The above graph (green line) shows that our warm water reserve is at 75°C at 08:45 in the upper part of our boiler. The first chute at 8:45 is due to a bath tub filling, at 9:05 one person takes a shower, at 09:30 a second person takes a shower. The remaining temperature is around 57°C.
Around 9:40, the sun is providing enough heat through the solar heat panels (yellow line) and the lower sector temperature (blue line) in the boiler begins to rise.
When the water temperature drops in the upper part of the boiler to 45°C, the gas heating will heat this part up to 55°C again. This normally takes around 10 minutes and consumes around 0.2 cubic meter of gas. (To properly measure this, the house heating part of the gas system is manually switched off. The only gas consumption is due to warm water heating.)

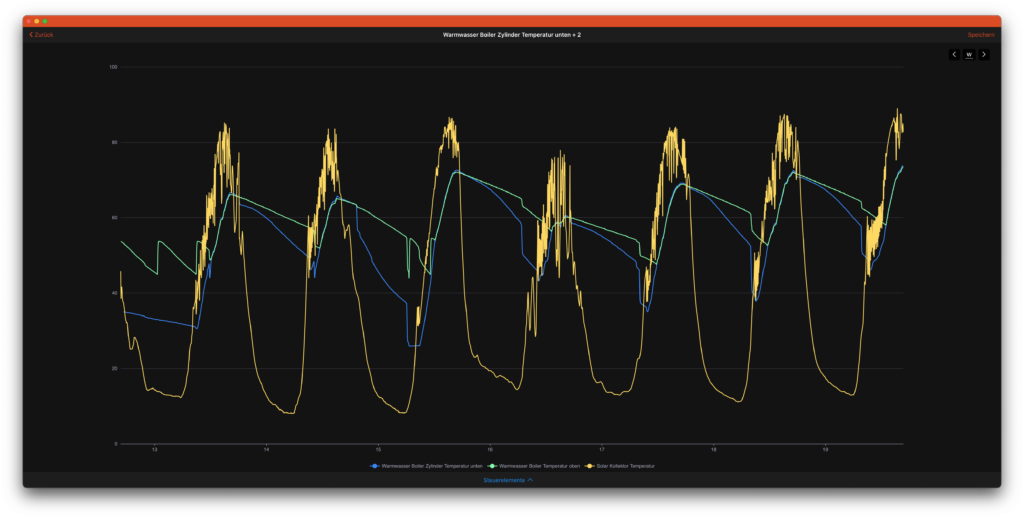
The above graph shows on the green line, above the Day 13 when the gas heating jumps in to heat up the upper part of the warm water reservoir. Over the week’s time shown in the graph, this happened 4 times. We are in July and outside temperatures are mid to end 20s°C and it is sunny.

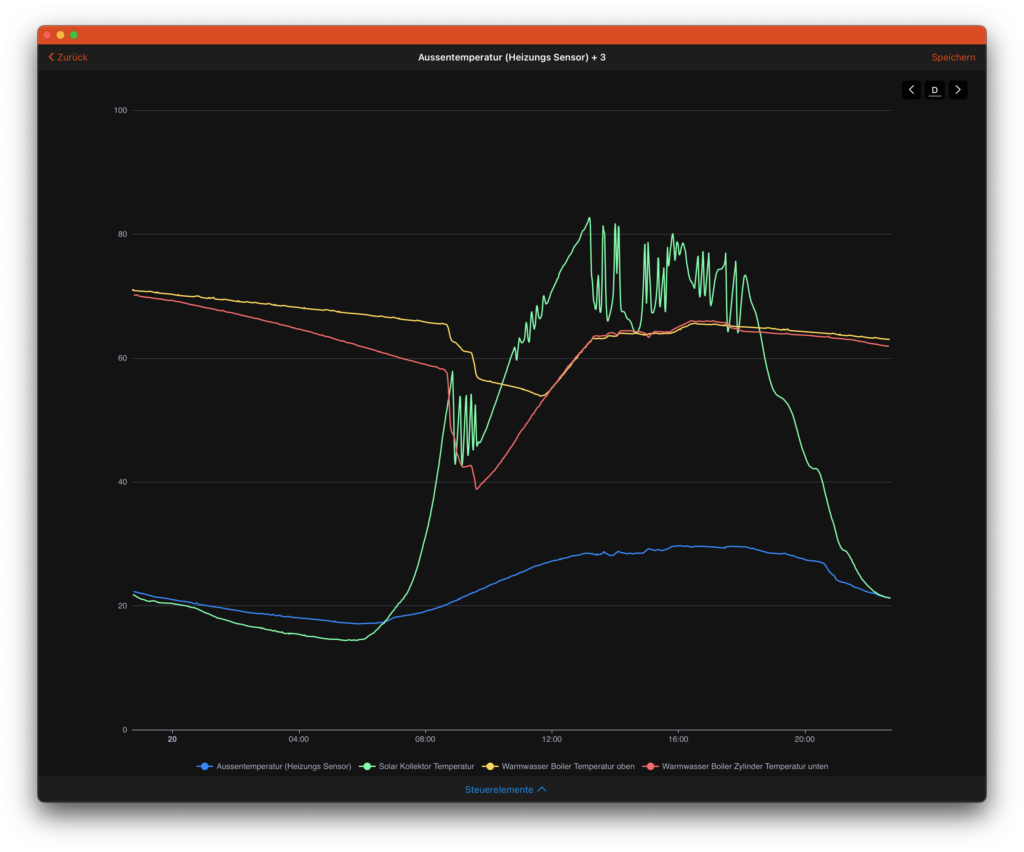
Over 10 hours, from 22:30 to 8:30, the temperature in the upper part (yellow line) of the hot water reservoir drops by 5.5°C. Of cours, the lower part drops quicker, but when using hot water, it is taken from the upper part. So the heat losses are around 0.55°C per hour when the hot water is around 70°C. The losses might vary, if the overall temperature is lower. The higher the overall temperature is (and thus the difference to the room temperature), the higher the loss of heat will be. Around 60°C, we measure 0.51°C losses per hour. These losses cannot be avoided. Any insulation will produce heat losses.