We found it particularly difficult to find objective real life data on the usage of solar heat panels for hot drinking water. Our solar system (installed for for hot water only, not for heating up the house) is configured to allow for hot drinking water temperatures up to 80°C. A (child-)protection is installed so that the boiler will never deliver more than 60°C at all times. The gas condensing heating system only kicks in when the water temperature in the upper part of the water reservoir drops to 45 °C and will stop heating when the upper part is at 55°C. The following examples are based on real data coming out of our system, which consists of a Buderus Logamax Plus GB162-25 v3 gas condensing heater and a Buderus SM300/1 W warm water reservoir.
To better understand how these water heating systems function, feel free to consult this article (in german). The article also shows a graph of the water reservoir with the upper and lower parts and its corresponding heating systems.
- Example of heat consumption after showering

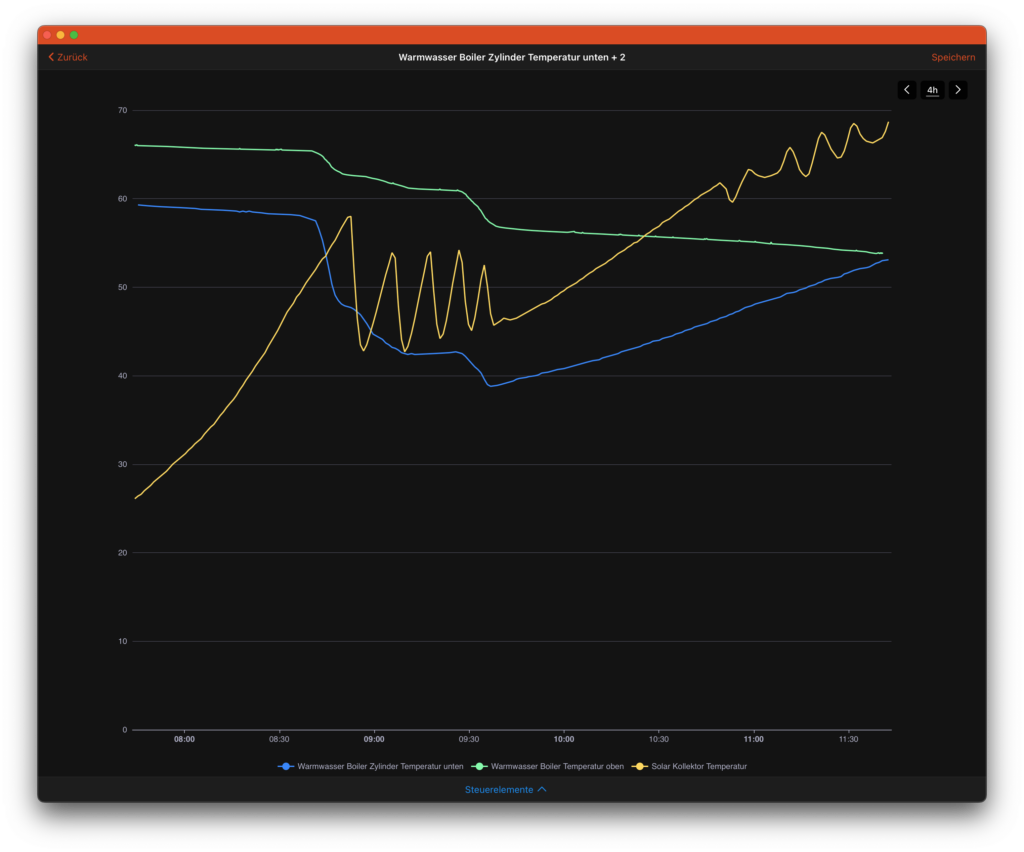
The above graph (green line) shows that our warm water reserve is at 75°C at 08:45 in the upper part of our boiler. The first chute at 8:45 is due to a bath tub filling, at 9:05 one person takes a shower, at 09:30 a second person takes a shower. The remaining temperature is around 57°C.
Around 9:40, the sun is providing enough heat through the solar heat panels (yellow line) and the lower sector temperature (blue line) in the boiler begins to rise.
- Example of the gas heating helping out to provide sufficient hot water
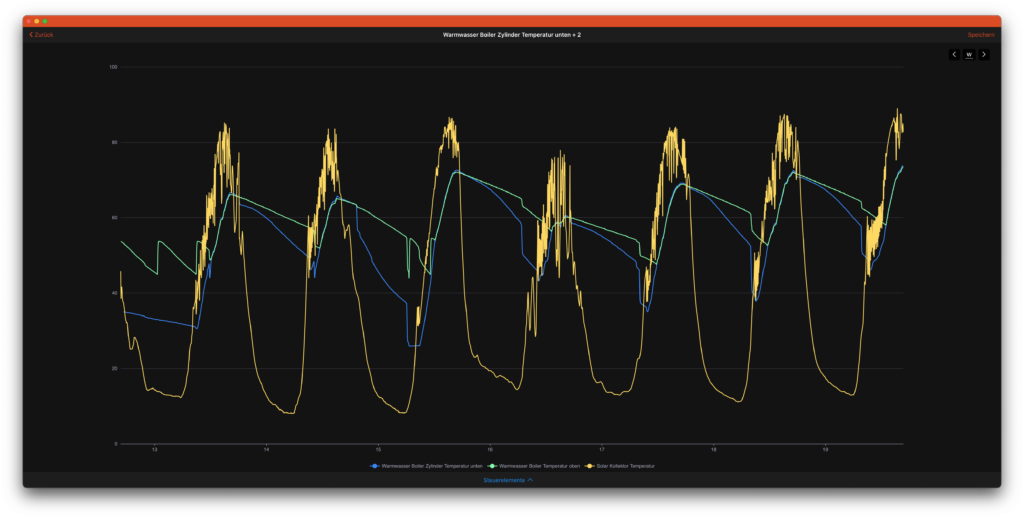
When the water temperature drops in the upper part of the boiler to 45°C, the gas heating will heat this part up to 55°C again. This normally takes around 10 minutes and consumes around 0.2 cubic meter of gas. (To properly measure this, the house heating part of the gas system is manually switched off. The only gas consumption is due to warm water heating.)

The above graph shows on the green line, above the Day 13 when the gas heating jumps in to heat up the upper part of the warm water reservoir. Over the week’s time shown in the graph, this happened 4 times. We are in July and outside temperatures are mid to end 20s°C and it is sunny.
- How much energy will be lost over night, when nobody uses warm water?

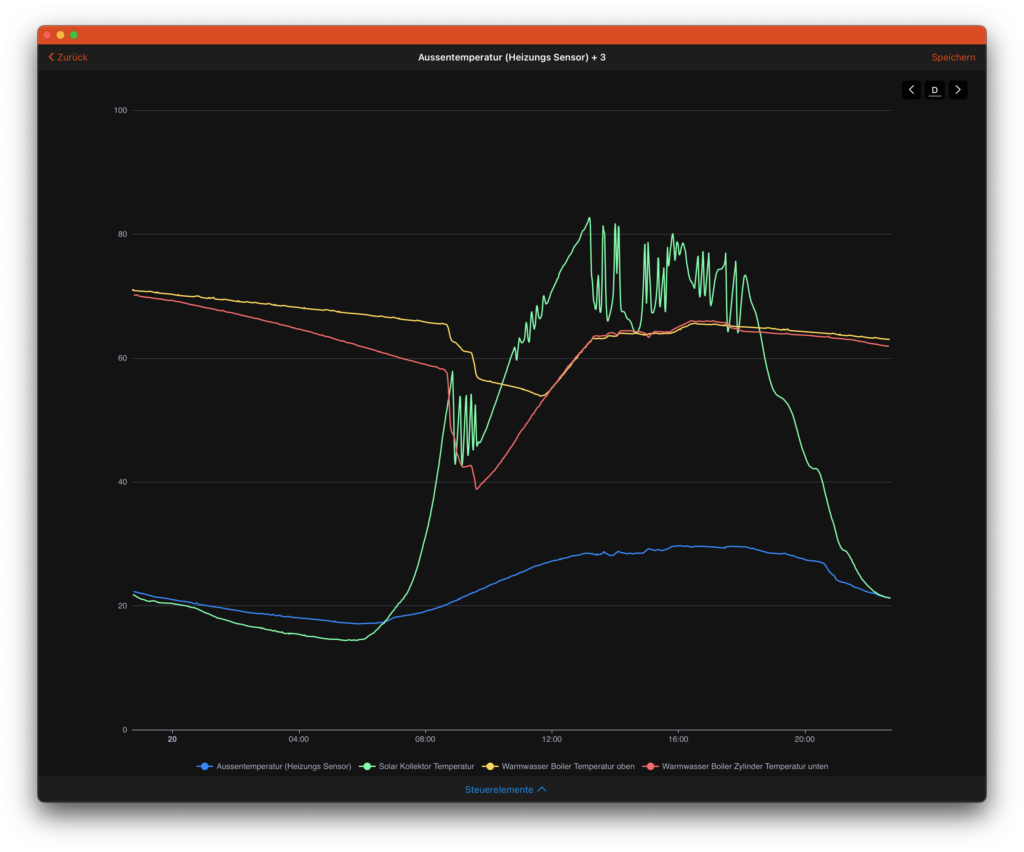
Over 10 hours, from 22:30 to 8:30, the temperature in the upper part (yellow line) of the hot water reservoir drops by 5.5°C. Of cours, the lower part drops quicker, but when using hot water, it is taken from the upper part. So the heat losses are around 0.55°C per hour when the hot water is around 70°C. The losses might vary, if the overall temperature is lower. The higher the overall temperature is (and thus the difference to the room temperature), the higher the loss of heat will be. Around 60°C, we measure 0.51°C losses per hour. These losses cannot be avoided. Any insulation will produce heat losses.
