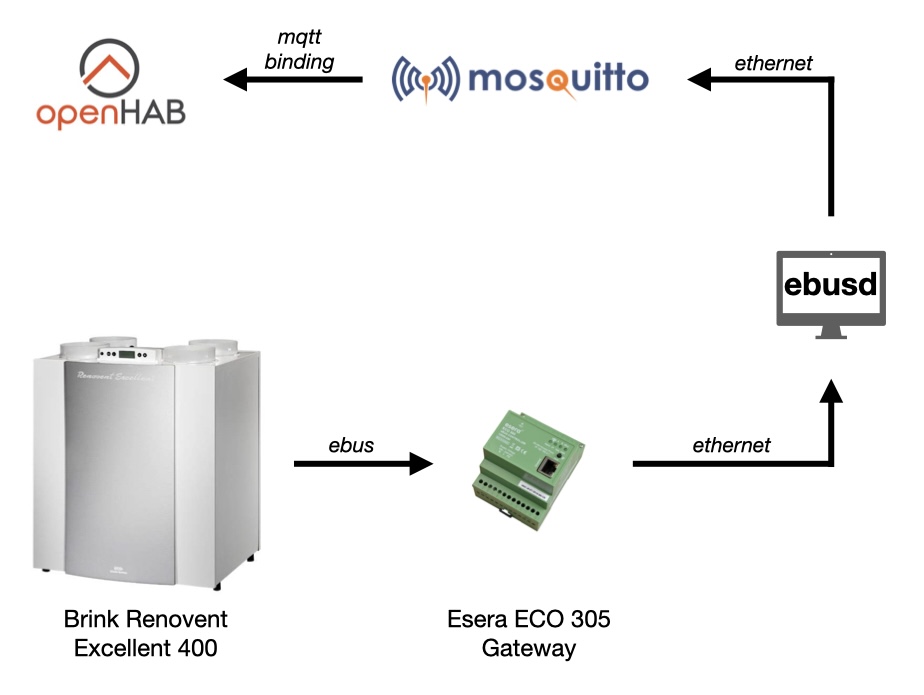
I am fetching my PV data over web calls; my openhab system (webcalls and enphase binding) requests these data from the local enphase gateway. In order for this to work, you need a JWT token from your enphase account. This token is valid exactly 1 year.
Step 1: open a Terminal and get a session ID from Enlighten:
Access the Renovent service menu: Use the menu button on the display to enter service mode and navigate to Parameter 08. Set to: eBus (Not OT – OpenTherme). Navigate to Parameter 09 (eBus mode) and configure Master (0) or Slave (1) mode. The Renovent can operate as either eBus Master or Slave. Slave mode (1) is recommended for passive monitoring. If you experience issues, try Master mode (0). I am running master mode.
Physical Connection
Step 1: Locate Renovent eBus Connection
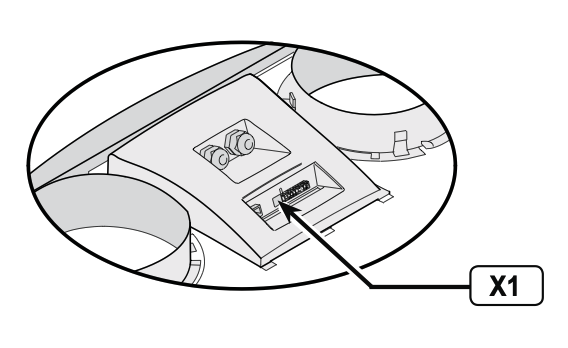
CRITICAL: Find the correct connector! X1 Connector: 2-pin green terminal block on the back of the Renovent display housing. NOT the X2 connector (used for other purposes). Refer to the Renovent service manual, page 14, for connector location diagrams.
X1 connector location on the top rear of the Renovent Excellent 400
Step 2: Connect to Esera Gateway
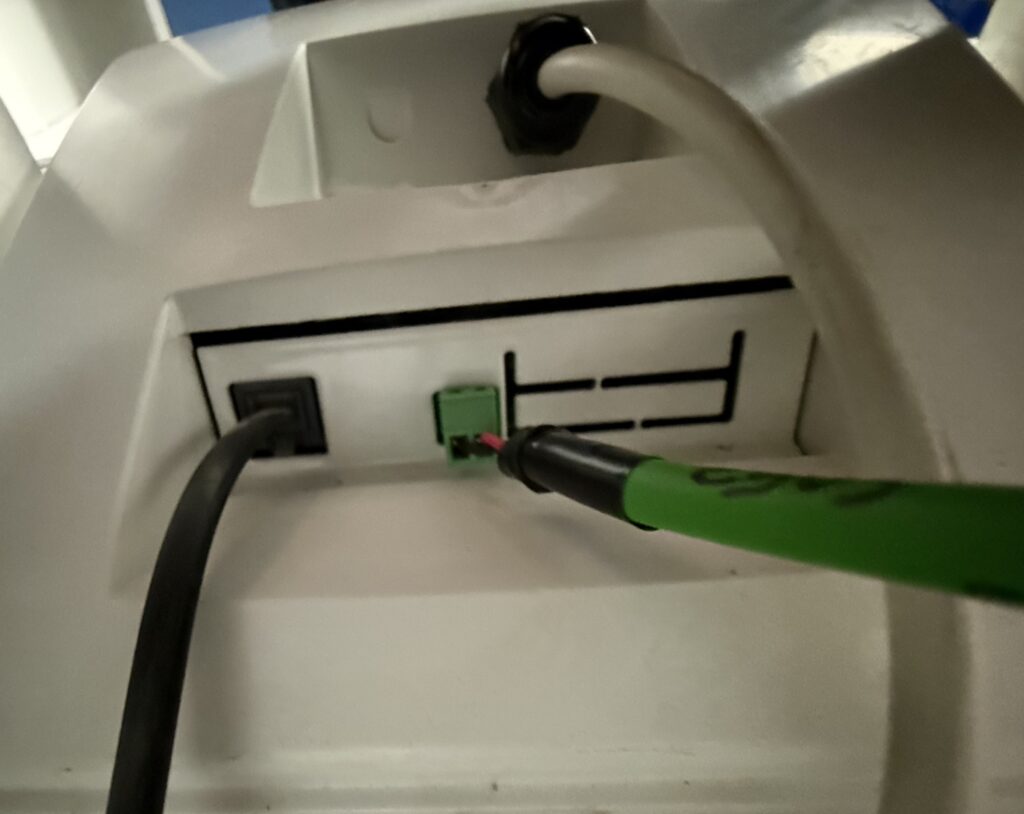
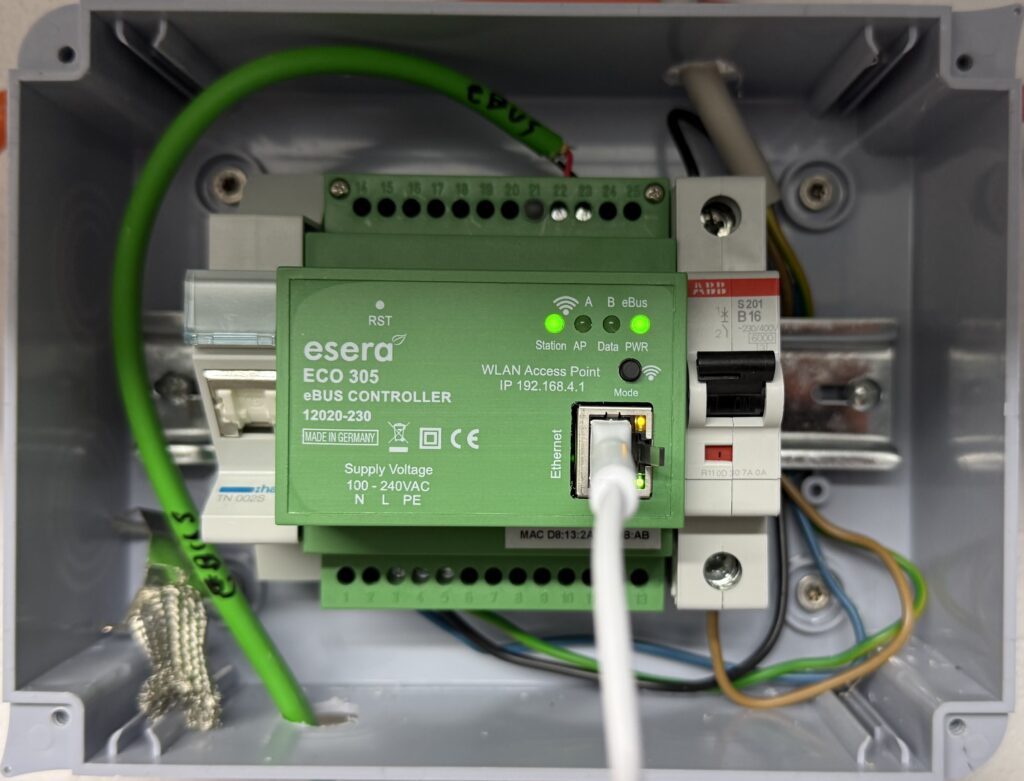
Wire the eBus connection: Switch off the Renovent appliance and the Esera gateway. Connect the Renovent X1 terminals to Esera eBus terminals. Polarity matters! Follow the wiring diagram. The following two pictures show which pins I connected on what device. You may use standard 2-wire cable (no shielding required for short runs). I used shielded KNX-EIB cable, as I had some spare lying around. Keep away from high-voltage AC cables. The following pictures show which pins I connected on what device.
X1 connection using a KNX-EIB shielded cableEsera gateway connection on pins 22 and 23
Do NOT use termination resistors. eBus does not need termination! Termination resistors will prevent proper communication. The Esera gateway has built-in termination.
Verify the connection. Switch on both devices. LED indicators on Esera should show activity once connected. PWR: Solid green means power OK. Station: Solid green means that the eBus is ready. Data: Flashing green ~1Hz (eBus communication)
Esera Gateway Setup
Step 1: Access Esera Web Interface
Connect your Esera gateway to your network. Access the web interface: `http://192.168.X.Y` (or your gateway IP). Default login password (eserapwd). Please change immediately.
Step 2: Configure eBus Settings
Navigate to: eBus Settings. You need to select: Server protocol: TCP Port: 5001 Automatic Bus Calibration: Automatic Mode Calibration Value: 130 (auto-detected) Compatibility: “Support ebusd enhanced protocol” (should be checked already)
Important: The “enhanced protocol” checkbox CANNOT be disabled – this is normal. Port 5001 uses the enhanced eBus protocol (required for ebusd). Port 5000 uses Esera ASCII protocol (not used in this setup).
Step 3: Verify Connection
Test the raw data flow. In your CLI, enter:
nc 192.168.X.Y 5001
You should see binary data streaming (appears as garbled characters): ƪƪƪƪw}@Ơƴƴƪƪƪƪ…
This confirms the Esera is receiving eBus data from the Renovent. CRITICAL: The Esera gateway only allows ONE TCP connection at a time to port 5001! If `nc` is connected, ebusd cannot connect. Always close test connections before starting ebusd.
LXC Container Setup
Step 1: Create LXC Container in Proxmox
Here is my config: OS: Ubuntu 24.04 LTS Hostname: ebus Memory: 512 MB Swap: 512 MB CPU: 1 core Disk: 8 GB (minimal, only needs ~2 GB) Network: Bridge to your LAN
Step 2: Initial Setup
SSH into your container, update your system and install wget.
ebusd Installation. Important: Always use the MQTT1 variant (includes MQTT support)
cd /tmp
wget https://github.com/john30/ebusd/releases/download/v26.1/ebusd-26.1_amd64-trixie_mqtt1.deb
ebusctl read -c Excellent400 Aussenlufttemperatur
# Should return a temperature value like: 10.2
Polling Script
Why a Polling Script? ebusd can passively listen to eBus telegrams, but the Renovent doesn’t broadcast all values automatically. We need to actively request data.
The Challenge: Setting `poll` in CSV files doesn’t work reliably with ebusd 26.1. Solution: External polling script that calls `ebusctl read`.
Script details: Polls **28 data points** every 10 seconds. Each read is redirected to `/dev/null` (we only care about MQTT publication). `sleep 10` controls update frequency. Customization: Increase `sleep 10` to `sleep 30` for less frequent updates (lower CPU usage). Remove unwanted data points to reduce eBus traffic (these are the ones I use). Add more data points from the CSV file as needed.
systemctl daemon-reload
systemctl enable ebusd-poll
systemctl start ebusd-poll

# Check status
systemctl status ebusd-poll
Step 3: Verify Polling
Check that values are being updated. Wait 15 seconds, then check:
ebusctl find -c Excellent400 | grep -v "no data" | head -10
You should see values instead of “no data stored”: Excellent400 Aussenlufttemperatur = 10.2 Excellent400 Ablufttemperatur = 22.0 Excellent400 TatsaechlicheZuluftmenge = 180
MQTT Message Format: All Excellent400 values: `{“0”: {“name”: “”, “value”: <VALUE>}}` Error messages: `{“error”: {“value”: “E100”}}` Global values: May vary in format JSON Path for extraction:$.0.value (for most messages)
For each data point, add a channel. Here is one example:
Channel ID: VmcAussenlufttemperatur
Label: VMC Aussenluft Temperatur
Channel Type: Number Value
State Topic: ebusd/Excellent400/Aussenlufttemperatur
Incoming Value Transformations: JSONPATH:$.0.value
Unit of Measurement: °C
Here is a different example. Error uses different JSON path: $.error.value instead of $.0.value:
Channel ID: VMC_errorCode
Label: VMC Error Code
Channel Type: Text Value
State Topic: ebusd/Broadcast/Error
Incoming Value Transformations: JSONPATH:$.error.value
Step 5: Create MAP Transformation Files
Bypass Status Map: /etc/openhab/transform/vmc_bypass.map
For each channel, create an Item and link it: Settings → Items → Create Item Select “Link to Channel” Choose the VMC MQTT Thing and specific channel Configure Item:
Type: Match channel type (Number/String)
Name: e.g., `VMC_Aussenluft_Temperatur`
Label: e.g., `Outside Temperature`
Category: Choose appropriate icon
State Description Pattern: Add MAP transformation if needed
- Example: `MAP(vmc_bypass.map):%s` for bypass status
Step 7: Understanding multi-value fields
Some values return multiple fields separated by semicolons: Format:Current;Min;Max;Step;Default Example:FilterverwendungTage returns 6;0;32767;1;0
- Current: 6 days
- Min: 0 days
- Max: 32767 days
- Step: 1 day
- Default: 0 days
This was one of the most complicated configurations I went through until now.
To check if users are active in database, or if they confirmed the registration email, start by connecting to the postgres database on your docker host:
Our micro inverter based solar installation (panel power: 16.46 kWp, AC output power: 12.2 kWp) runs since February 2025. (open picture in new tab to zoom in)
If you do not want to keep large WAV or AIFF files on your disk that eat up precious space, you can use Apple’s Automator to write a quick action to easily convert these files to m4a.
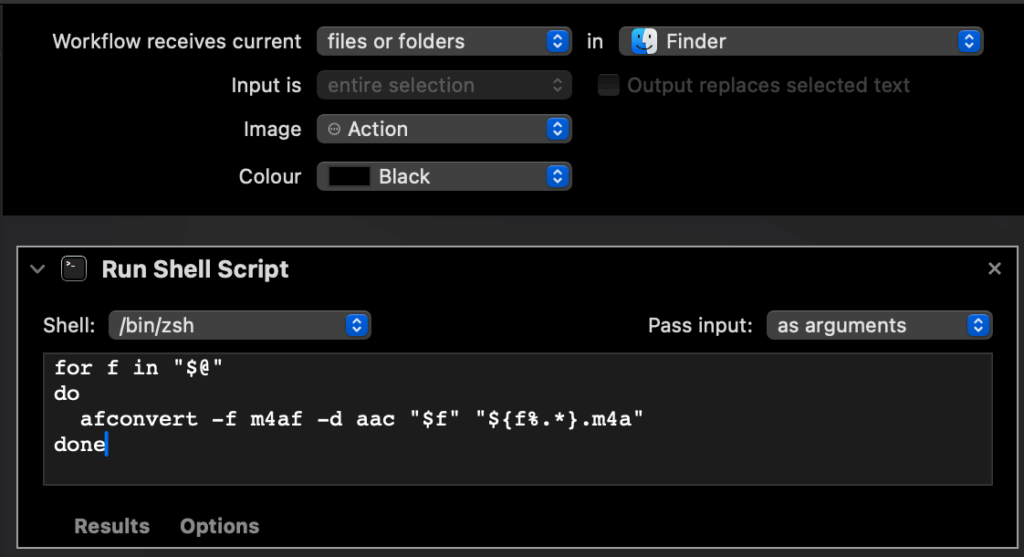
Open Apple’s Automator and create a new quick action.
Automator: convert audio files to m4a
for f in "$@"
do
  afconvert -f m4af -d aac "$f" "${f%.*}.m4a"
done
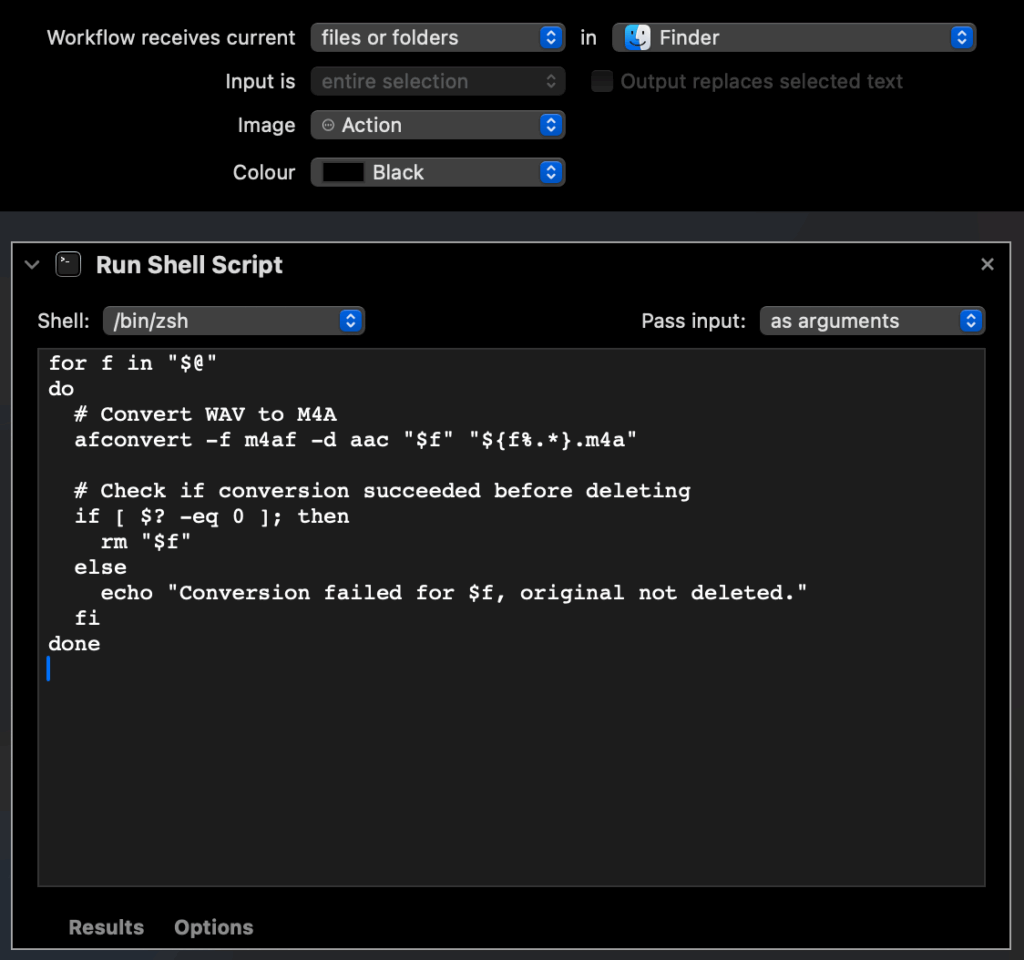
You can also have Automator delete the original file after conversion:
Automator: convert audio to m4a and delete original file
for f in "$@"
do
  # Convert WAV to M4A
  afconvert -f m4af -d aac "$f" "${f%.*}.m4a"

  # Check if conversion succeeded before deleting
  if [ $? -eq 0 ]; then
    rm "$f"
  else
    echo "Conversion failed for $f, original not deleted."
  fi
done
These quick actions also work on video files (like mp4), in case you are only interested in keeping the audio track of a video file.
The above quick action workflows can be downloaded below:
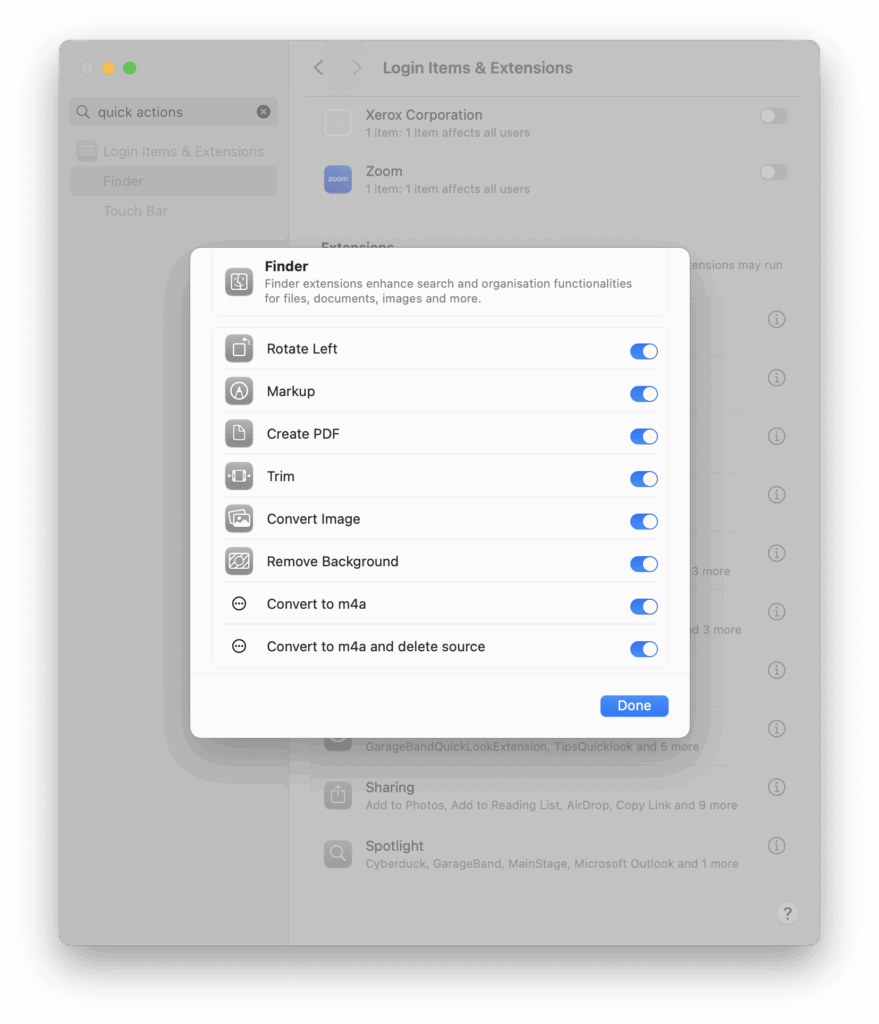
To install the workflows as quick actions, you can download the above files, unzip and execute. macOs will then install the workflows. Your macOS security protection still keeps them disabled. You have to enable them in system preferences. Open Login Items & Extensions, under Extensions, behind the Finder line, hit the “i” button:
macOS system settings: enable the quick action
Source: These scripts have been developed with the help of a generative large language model.
Luxembourg’s smart meter branded as Smarty by the electric grid managing company CREOS allows monitoring your electricity consumption and production as well as your gas consumption. Additionally it allows the grid operator to control certain electrical appliances in your household.
Shedding relays – relais de délestage
If parts of the electricity grid in Luxembourg are becoming overloaded or unstable, the grid operator can remotely command the Smarty smart meter to take action to protect the grid. Smarty can diminish the power of domestic car charging points from 11kW to 7kW. As of writing this, CREOS confirms not using this feature (January 2025).
Smarty can also reduce the power of photovoltaic systems to about a third of the available power, if your PV management system allows this. If not, the shedding relay (FR: relais de délestage) will fully shut down the PV system when asked by the grid operator. It seems that this is currently not used neither by CREOS.
Smarty can also limit charging power of night storage heaters (DE: Nachspeicherheizung, FR: chauffage à accumulation) systems through shedding relays.
Billing
Every 15 minutes, the Smarty transmits to the grid operator (or the third party data collection partner) the average electricity consumption of the last 15 minutes. This is used to bill the quantity of electrical energy that was consumed, as well as the monitoring of the load that you used on the grid.
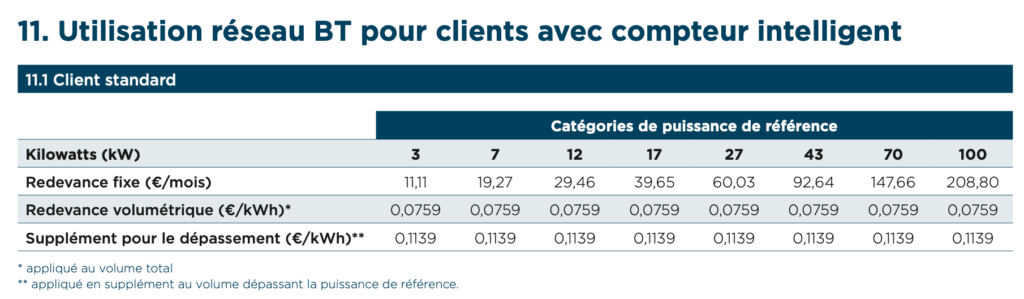
As of 1st January 2025, every household in Luxembourg is categorised in a power consumption category. Most households are in category 3 kW. Households with electric cars or heat pumps might be categorised into 7 kW or 12 kW categories. The monthly costs depend on the power consumption class that you are in.
If you are in the 3 kW category, and you drag 5 kW from the grid for about an hour, you have to pay additional fees (FR: supplément pour le dépassement), in this case: 5-3=2 kWh, which currently equals to 2*0.1139€ = 0,2278€.
If you use for example a (tea) water heating device that pushes your maximal power consumption over the 3 kW limit for about a minute, the fact that Smarty calculates the average over 15 minutes should assure that this short stepping over your category’s boundaries should not be visible on your invoice.
To find out what your power category is, check your electricity provider’s portal, like myenovos.eu.
Balancing out consumption and production on 3-phase grids
When you are running a balcony power plant (DE: Balkonkraftwerk), you might be interested in how the Smarty manages billing or settlements of electricity production over the three phases. In Luxembourg, a normal household is connected to the power grid on 3 phases each capable of pumping 40A of current.
When you connect such a small photovoltaic system to a power socket on your balcony, it will feed the produced electricity only to the phase where you connected it. But this might not be the phase where your house is consuming most electricity, so you are feeding your produced electricity to the grid and drag the electricity from the grid that you need on the other phase (buying from thew grid is much more expensive then what you get paid for injecting electricity).
But there is good news: the smarty will balance this out (DE: saldierender Stromzähler), as it sums up power consumption on all three phases and power production on all three phases and only considers the difference for billing. Without this, a (mono-phase) balcony power plant is not really interesting for private use.
[Unfortunately I only have oral confirmation of this from an engineer. No guarantee on this information. It might also change over time.]
Monitoring your consumption and production
You have three possibilities to extract consumption and production data from your Smarty smart meter.
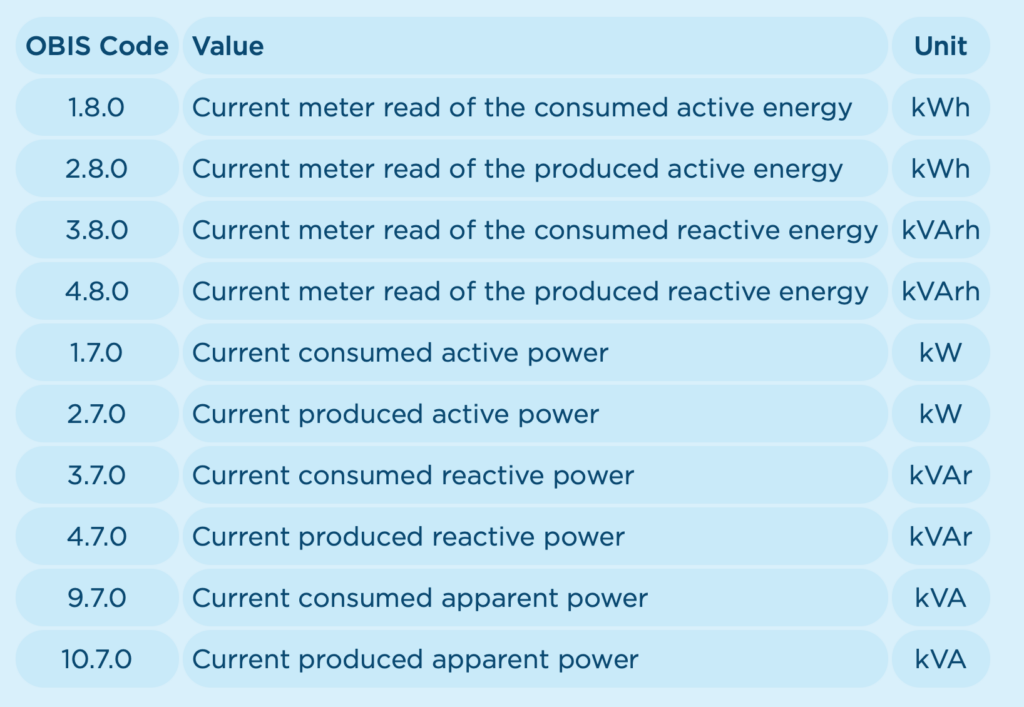
(1) By default, Smarty shows the most important values in a 5 seconds rhythm. Additionally: With the green button on your Smarty, you can cycle through the data that the meter gathers. To understand what value is currently displayed, Smarty adds the OBIS code to the display.
OBIS codes
(2) Plug the Smarty+ dongle into your Smarty meter’s P1 port and monitor your data on your smartphone
(3) Connect the P1 port over a serial / USB to a computer and monitor your data using a home automation software like for example openHAB with the help of the DSMR binding.
When using the P1 port, solution 2 & 3, you need to ask the grid operator to give you the P1 decryption key.
It sometimes happens that when I shutdown Proxmox for some hours, that after restart, the network interface does not work. I figured that Proxmox is rotating the network interface numbers which leads to the Linux network bridges to not map to the correct network interface and thus leads to no network connectivity. The only thing that helps is to adapt the /etc/network/interfaces file.
Some commands that can help:
brctl show
ifconfig vmbr0
dmesg
lspci | grep -i ethernet